Causes & Mechanisms
The physical mechanisms that create low-risk geographic regions stem from tectonic stability, atmospheric currents, and topography. To understand why certain states maintain immunity from catastrophic events, you must analyze how regional geology and atmospheric science shield specific landmasses from nature’s most destructive forces.
Seismic risk relies heavily on plate tectonics. States located far from active tectonic plate boundaries experience minimal fault friction and localized stress release. When analyzing seismic hazards, scientists distinguish between magnitude vs. intensity. Magnitude measures the total physical energy released at an earthquake’s epicenter on a logarithmic scale, whereas intensity measures the actual ground shaking and localized structural damage observed at a specific location on the surface. Regions in the Upper Midwest and Mid-Atlantic sit atop stable cratons—ancient, rigid parts of the continental crust—where high-magnitude quakes almost never occur, keeping ground shaking intensity consistently low.
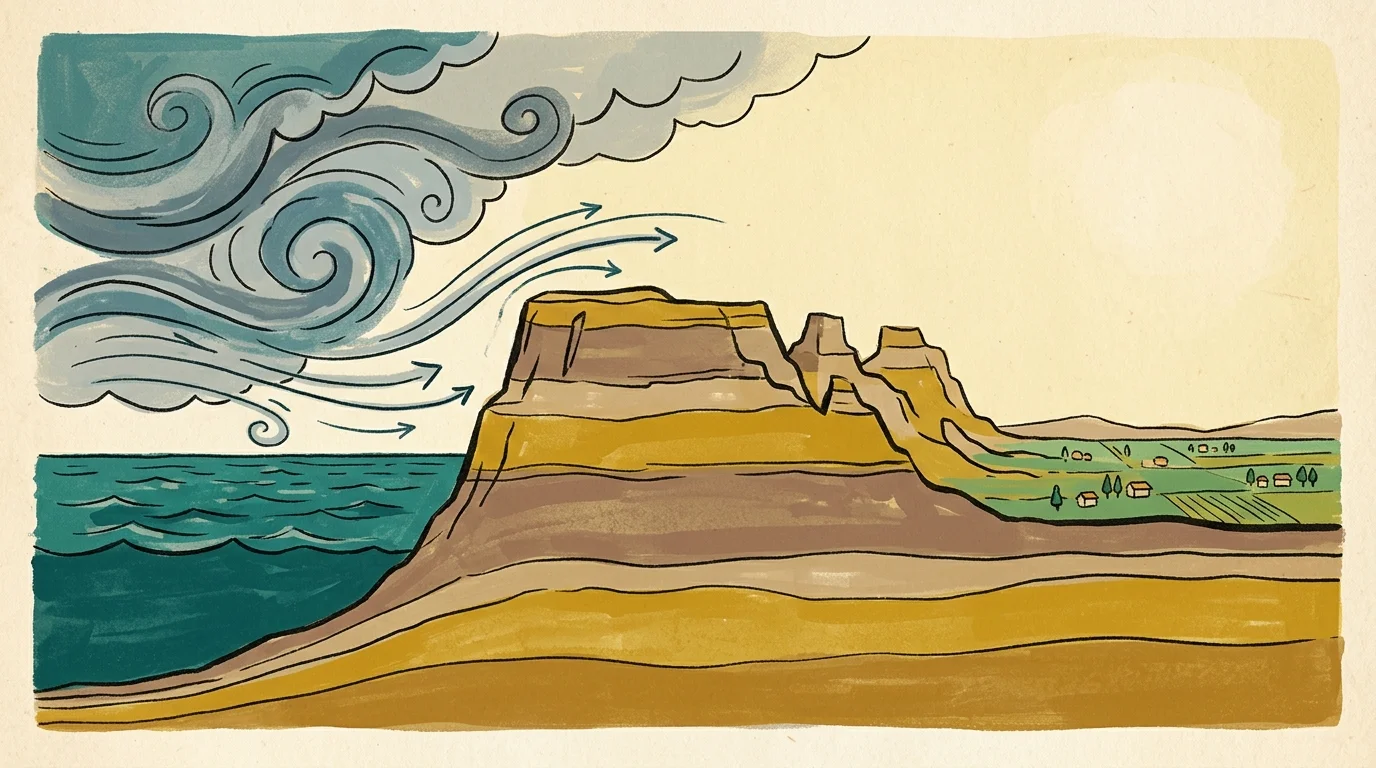
Coastal atmospheric hazards depend on oceanic thermal energy and atmospheric steering currents. Hurricanes require warm ocean waters above 80 degrees Fahrenheit (26.5 degrees Celsius) and low vertical wind shear to develop and sustain momentum. Coastal states in the Southeast and Gulf Coast sit directly in the path of tropical cyclones that generate catastrophic storm surge. Storm surge defines an abnormal, rapid rise of water generated by ocean storm winds pushing seawater above normal astronomical tides. Inland states like North Dakota, Nebraska, and Kansas lie hundreds of miles from tropical waters, completely eliminating the physical possibility of storm surge and tropical hurricane force winds.
Hydrological threats like riverine and flash flooding depend on drainage basins, elevation shifts, and localized precipitation rates. The states least likely to flood feature deep, well-draining soils, moderate topographic slopes, and predictable precipitation baselines. Hydrologists conduct root cause analysis when evaluating regional flood dynamics. Root cause analysis is a structured problem-solving method that isolates the fundamental physical or systemic vulnerabilities responsible for a failure rather than merely treating visible symptoms. In flat, agricultural midwestern states with deep glacial till, rainfall infiltrates the ground efficiently, preventing the rapid surface runoff that triggers destructive flash floods in mountainous or paved coastal environments.
Disaster analysts differentiate between primary vs. secondary impacts when scoring natural hazard exposure. Primary impacts occur as a direct result of the hazard event itself, such as structural roof collapse caused by high wind gusts or wall cracking caused by ground tremors. Secondary impacts stem from the downstream disruption of primary systems, such as waterborne disease outbreaks after sewer overflow, prolonged electrical grid failures, or long-term supply chain collapse. Low-risk states experience minimal primary impacts, which prevents the cascading failure of secondary municipal infrastructure.
To evaluate natural hazard vulnerability mathematically, risk engineers calculate Expected Annual Loss (EAL). EAL quantifies the anticipated economic loss in dollars resulting from natural hazards over a single calendar year. The mathematical model integrates asset exposure, annual hazard frequency, and structural vulnerability according to the formula: Expected Annual Loss equals Exposure multiplied by Hazard Frequency multiplied by Vulnerability Rate.
Consider a practical mini-example comparing hazard loss mechanisms between a coastal county in Texas and a rural county in North Dakota. In a hurricane hazard model for a coastal Texas county, $500,000,000 in residential real estate exposure faces an annual hurricane frequency of 0.08 (representing one major storm event every 12.5 years). Assuming a structural vulnerability rate of 0.15 (15% average property loss per storm event), the resulting Expected Annual Loss calculation yields: $500,000,000 times 0.08 times 0.15 equals $6,000,000 in annual expected loss from tropical cyclones alone.
Conversely, for Cass County, North Dakota, the coastal hurricane exposure is $0, the hazard frequency is 0, and the vulnerability rate is 0, yielding an EAL of $0. Even when evaluating Cass County against severe winter weather, where property exposure is $200,000,000 and the winter storm frequency is 0.5 per year, strict cold-weather building codes keep the structural vulnerability rate at an extremely low 0.001 (0.1% loss per severe snow event). The winter weather calculation yields: $200,000,000 times 0.5 times 0.001 equals $100,000 in annual expected loss. This mathematical disparity illustrates why inland midwestern states sustain exceptionally low composite risk ratings.